


Track these seven KPIs first: first-time fix rate, technician utilisation, average response time, CSAT/NPS, cost per job, SLA compliance and callback rate. Aim for a first-time fix rate that is healthy for your business, response times that meet urgent customer expectations, and keep callback rates as low as feasible. The rest of this guide covers the formulas, review cadence, and the levers that actually move these numbers.
TL;DR:
- Improving first-time fix rates requires better parts pre-kitting and diagnostics before dispatch, as it directly impacts customer satisfaction and cost efficiency.
- Reducing truck roll rate involves implementing phone triage protocols to minimize unnecessary site visits while maintaining a high first-time fix rate.
- Consistent, accurate data collection is essential for tracking KPIs such as response times, cost per job, and DSO, often supported by automated invoicing and logging tools.
- Monitoring employee turnover and retention quarterly helps stabilize KPIs like FTFR and customer satisfaction, as staff changes significantly affect performance.
- Focusing on a few key KPIs at a time, particularly those related to cash flow or quality, and implementing targeted actions leads to meaningful operational improvements.
Table of Contents
- What are the best field service KPIs to track first?
- How do you measure field service KPIs accurately?
- Which KPIs should you review weekly versus monthly?
- What actions actually move your field service KPIs?
- How Ask Hayley helps tradies capture the data behind their KPIs
- What does mean time between failures tell you?
- Why does schedule adherence matter for field teams?
- What is truck roll rate and why should you track it?
- How do inventory turnover and parts usage affect performance?
- How do employee turnover and retention affect your KPIs?
- Author perspective: don’t chase every KPI at once
- Try Ask Hayley to close the gap between good KPIs and good data
- Sources
What are the best field service KPIs to track first?
Field service KPIs only earn their keep when they connect to a real business outcome, someone owns them, and you review them on a set schedule. Without those three things, you’ve got a metric, not a KPI. Here’s the catalogue Australian trade and service businesses use to run tighter operations and win back margin.
First-time fix rate (FTFR) measures the percentage of jobs resolved in a single visit without a return trip for the same issue.
Formula: (Jobs fixed first visit ÷ Total jobs) × 100
If your team completes 180 jobs this month and 140 are fixed without a follow-up, that’s a 77.8% FTFR. This is arguably the single most diagnostic number in field service, because it touches customer satisfaction, technician productivity and fuel costs in one figure. Improve it by requiring pre-visit diagnostics and better parts kitting before the van leaves the yard.
Mean time to repair (MTTR) tracks how long a repair takes from the moment work starts to job completion.
Formula: Total repair time ÷ Number of repairs
A technician who logs 12 hours across six repairs in a week has an MTTR of two hours. Reduce it with clearer fault diagnosis at intake and standard repair checklists.
Average response time measures how long customers wait between raising a job and a technician arriving on site.
Formula: Sum of (arrival time − request time) ÷ Number of jobs
Best-practice guides consistently rank response time alongside FTFR and technician utilisation as core operational KPIs. Tighten it with geo-based dispatching that assigns the nearest available tech, not just the next one in the queue.
Technician utilisation shows what proportion of paid hours are spent on billable work.
Formula: (Billable hours ÷ Total available hours) × 100
A tech working 34 billable hours out of a 38-hour week sits at 89.5% utilisation, comfortably in the healthy range. Push it higher through smarter route planning and fewer scheduling gaps.
Jobs per day is a simple volume measure: completed jobs divided by technician workdays. It’s most useful alongside utilisation, since high job counts with low FTFR usually mean rushed work.
Cost per job captures labour, parts, travel and overhead allocated to a single job.
Formula: (Labour + Materials + Travel + Overhead) ÷ Number of jobs
Trade services leaders watching margin closely track job costing right alongside utilisation and cycle time. Tighten pricing accuracy by comparing quoted cost against actual cost job by job.
Days sales outstanding (DSO) / time-to-invoice measures how long it takes to get paid after work is done.
Formula: (Accounts receivable ÷ Total credit sales) × Number of days
Time-to-invoice is one of the most overlooked levers for cash flow in trade businesses, precisely because it’s rarely reviewed alongside the “sexier” operational KPIs. Mobile, on-site invoicing closes this gap fast.
Callback / rework rate tracks the share of jobs requiring a return visit for the same fault.
Formula: (Callback jobs ÷ Total jobs) × 100
CSAT and NPS are related but distinct. CSAT scores satisfaction with a specific job, usually on a 1 to 5 scale straight after completion. NPS asks whether a customer would recommend your business, and reflects overall loyalty rather than one job. CSAT is immediate; NPS is lagging — treat them as different instruments, not interchangeable scores.
Recurring revenue / contract attach rate measures the proportion of customers on service agreements versus one-off jobs, a strong predictor of predictable cash flow.
How do you measure field service KPIs accurately?
Getting these numbers right depends on clean, consistent data. Here’s what you need and how to calculate the trickiest ones without ambiguity.
-
Gather your raw data sources first. You need job timestamps (request, dispatch, arrival, completion), invoice and payment dates, technician timesheets, parts usage records, and CSAT responses tied to a specific job ID.
-
Calculate FTFR against a strict definition. A “first-time fix” only counts if the customer reports no repeat issue within an agreed window, typically 30 days. Count a job as a callback if a technician returns for the same fault, not a different one.
-
Work out utilisation from rostered hours, not contracted hours. If a technician is rostered for 40 hours but takes a day of leave, use 32 available hours as the denominator, not 40, or you’ll understate utilisation.
-
Calculate cost per job by allocating overhead proportionally. Divide monthly overhead (vehicle, insurance, admin wages) by total jobs completed that month, then add it to direct labour and materials for each job.
-
Calculate DSO using a rolling 90-day window. (Accounts receivable at period end ÷ Total credit sales in the period) × 90 gives a more stable figure than a single month, which can swing wildly with one large unpaid invoice.
-
Calculate SLA compliance as a simple pass/fail ratio. (Jobs meeting the agreed response or completion window ÷ Total SLA-bound jobs) × 100. Define the SLA clock precisely, whether it starts at the call, the booking, or the promised window.
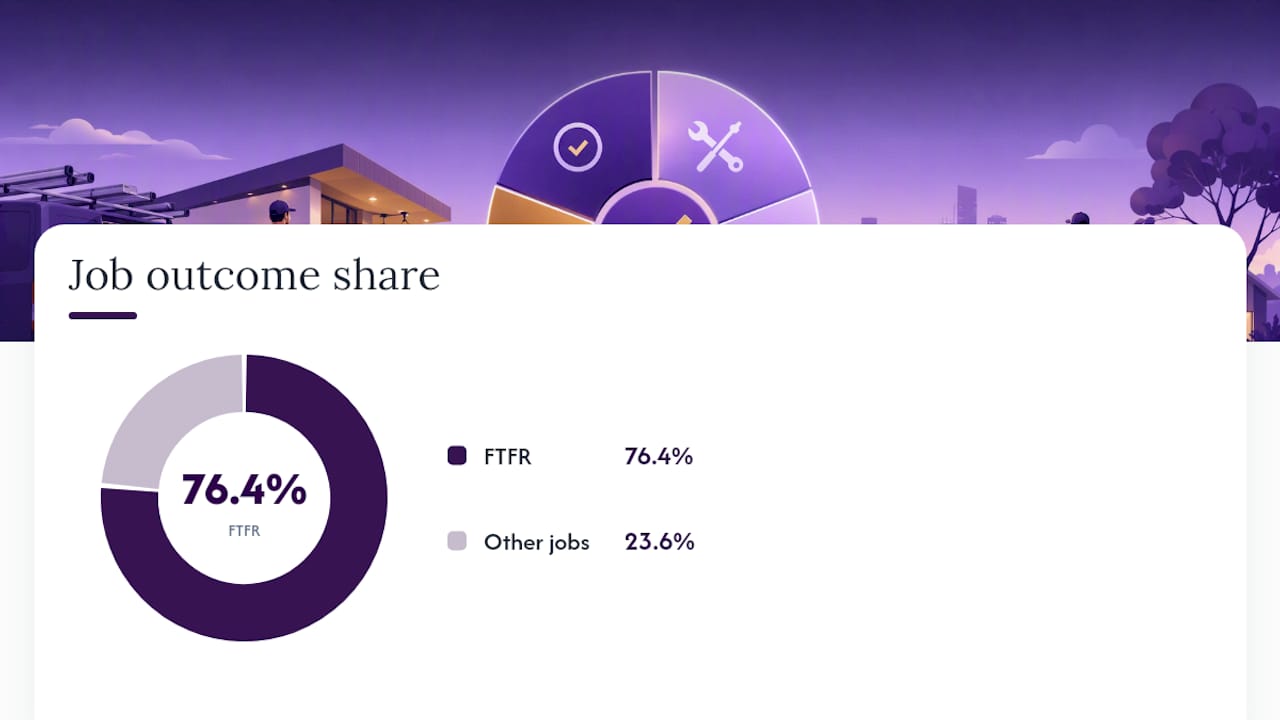
Worked example: A team completes 220 jobs in a month. 168 are fixed first visit (76.4% FTFR), average cost per job comes to $285, and DSO sits at 38 days. That’s a workable baseline to track against next month.
Common pitfalls include mixing definitions across contractors (one crew counts “arrival” as parking outside, another as knocking on the door), letting overhead allocation drift month to month, and measuring CSAT only from customers who respond, which skews the average upward. Standardise definitions in writing and apply them the same way across every team and subcontractor.
Which KPIs should you review weekly versus monthly?
Not every KPI deserves the same attention every week. The trick is matching your KPI selection to whatever’s hurting most right now, whether that’s cash, quality or growth.
- If cash flow is the pain point, prioritise DSO, time-to-invoice and cost per job.
- If quality or reputation is slipping, watch FTFR, callback rate and CSAT.
- If you’re trying to grow, track jobs per day, utilisation and contract attach rate.
Review operational numbers like response time, jobs completed and daily schedule adherence weekly. These change fast and need quick correction. Push cash and strategic metrics like DSO, CSAT trends and technician turnover into a monthly or quarterly review, where you’re looking for direction rather than daily noise.
Practical rollout guidance backs this up: pick one or two KPIs tied to your current biggest problem, run them for four to six weeks to establish a genuine baseline, then add the next KPI only once the first is stable. Trying to manage all thirteen KPIs from day one guarantees none of them get the attention they need.
Set SMART targets against that baseline rather than industry averages pulled from a different market or business size. If FTFR sits at 68% after your baseline period, a target of 75% within a quarter is realistic; jumping straight to 90% usually just means the definition gets rubbery. Escalate when a KPI moves more than 10% against its baseline for two consecutive review periods, that’s the signal something structural changed, not just normal week-to-week noise.
Pro Tip: Write the KPI’s owner and review date directly into your dashboard or spreadsheet header. A number nobody owns gets looked at once and forgotten.
What actions actually move your field service KPIs?
Picking the right KPI is only half the job. Here’s what actually shifts the number, not just what sounds sensible in a planning meeting.
- Lift FTFR by kitting parts against the job type before dispatch, and running a five-minute pre-visit diagnostic call so the technician arrives with the right gear, not guessing.
- Lift technician utilisation through tighter routing and job batching by suburb or service type, cutting the dead time between jobs. Structured scheduling frameworks for dispatchers can shave real minutes off every run.
- Lift CSAT with a one-click survey sent the moment a job closes, plus a defined remedial path (a call from a supervisor within 24 hours) for any score below three.
- Protect cost per job with disciplined job costing, checking quoted versus actual cost weekly rather than at month end, when the pricing gap has already compounded across dozens of jobs.
- Cut DSO by invoicing from the job site before the van leaves, not days later from an office desk, paired with automated payment reminders at seven and fourteen days overdue.
- Improve SLA compliance and response time with geo-based dispatch rules that prioritise the closest available technician and flag jobs approaching their SLA window before they breach it.
Sequence these changes rather than launching all six at once. Start with whichever lever touches your worst-performing KPI, run it for a full review cycle, and measure the shift before layering on the next change. A documented field service workflow makes it far easier to isolate which change actually caused the improvement, rather than guessing after the fact.
Expect FTFR gains from better kitting to show up within two to three weeks, since the effect is immediate on the next batch of jobs. DSO improvements from mobile invoicing usually take a full billing cycle, around 30 days, before the average shifts meaningfully. Test one change, hold everything else steady, and give it time before declaring victory or moving on.
How Ask Hayley helps tradies capture the data behind their KPIs
Most of the KPI headaches above trace back to one root cause: admin that gets done late, inconsistently, or not at all. Ask Hayley answers calls when you can’t, logs job details as they happen through voice prompts, and pushes accurate response timestamps straight into your records instead of relying on memory at day’s end. That directly tightens your response time data and SLA tracking.
Because Hayley integrates with Xero and AroFlo, invoicing can happen closer to job completion, pulling DSO down without you chasing paperwork. Built-in CSAT capture and lead pre-qualification also mean cleaner customer satisfaction data and fewer wasted call-outs from unqualified leads.
What does mean time between failures tell you?
Mean time between failures (MTBF) measures the average operating time between one equipment failure and the next, and it matters most for businesses servicing HVAC systems, pumps, generators, or any equipment under maintenance contracts.
Formula: Total operating hours ÷ Number of failures
If a piece of equipment runs for 4,000 hours across a year and fails four times, MTBF is 1,000 hours. A rising MTBF tells you preventive maintenance is working; a falling one flags ageing equipment or a maintenance schedule that’s slipping.
MTBF and MTTR work as a pair. MTBF tells you how often things break; MTTR tells you how fast you fix them once they do. A service business chasing contract renewals should watch both, because a client with high MTBF but a painfully slow MTTR still ends up frustrated, waiting weeks for a fix on a rare fault.
Track MTBF at the asset level where you can, not just averaged across your whole client base. A single unreliable unit dragging down the average can hide the fact that ninety per cent of your fleet is running fine. If you manage recurring maintenance contracts, MTBF by equipment type also helps you have an honest conversation with a client about whether it’s time to replace ageing gear rather than keep patching it.
Why does schedule adherence matter for field teams?
Schedule adherence tracks how closely technicians stick to their planned daily schedule, measured as the percentage of scheduled jobs started and finished within their allocated windows.
Formula: (Jobs completed within scheduled window ÷ Total scheduled jobs) × 100
Poor adherence has a compounding effect across a day. One job that runs 40 minutes over pushes every booking behind it, and by 3pm your afternoon customers are getting a technician two hours late with no warning. That’s where SLA breaches and CSAT drops usually start.
Build slack of 15 to 20 minutes between jobs rather than back-to-back scheduling with zero buffer, particularly for job types with variable complexity like electrical fault-finding versus routine servicing.
Review adherence weekly at the individual technician level and monthly at the team level. A technician running consistently behind isn’t necessarily underperforming; it might mean their jobs are systematically under-quoted for time, which is a scheduling and quoting problem, not a productivity one.
What is truck roll rate and why should you track it?
Truck roll rate measures the percentage of service calls that require an on-site visit versus those resolved remotely, over the phone, or through a customer’s own troubleshooting.
Formula: (Jobs requiring a site visit ÷ Total service requests) × 100
A high truck roll rate isn’t automatically bad, plenty of trade work genuinely needs boots on the ground. But if your rate is climbing while your first-time fix rate is falling, that’s a signal you’re sending technicians out under-informed, turning what should be a phone diagnosis into an unnecessary drive.
Reducing unnecessary truck rolls saves fuel, technician hours and scheduling capacity that could go to paying jobs elsewhere. A short structured phone triage before booking, asking about symptoms, recent changes and basic checks the customer can do themselves, catches a meaningful share of issues that don’t need a visit at all, particularly on simple electrical or appliance faults.
Track truck roll rate alongside FTFR rather than in isolation. The combination tells you two different stories: whether you’re sending technicians out when you don’t need to, and whether they’re prepared when you do. A business with a low truck roll rate but also a low FTFR has a diagnosis problem on the phone, not just an efficiency one.
How do inventory turnover and parts usage affect performance?
Inventory turnover measures how many times you use and replace your parts stock over a given period, revealing whether you’re carrying too much dead stock or running short at the worst moment.
Formula: Cost of parts used ÷ Average inventory value
A trade business holding $20,000 in average parts stock and using $80,000 worth across the year has an inventory turnover of four. Low turnover usually means cash tied up in parts sitting on a shelf; extremely high turnover can mean you’re understocked and making emergency supplier runs that blow out job timelines.
Parts usage data also feeds directly back into FTFR. If technicians frequently arrive without the right part, that’s very often a stocking problem masquerading as a callback problem. Track which parts get requested but aren’t on hand at the time of a job, then adjust van stock levels for the technicians and job types where that gap shows up most.

Review inventory turnover monthly, and cross-reference it against callback rate. If a specific part is chronically out of stock and tied to a chunk of your callbacks, that’s a stocking fix, not a training issue, and it’s usually the cheaper problem to solve.
How do employee turnover and retention affect your KPIs?
Employee turnover measures the percentage of technicians who leave your business over a set period, and it has an outsized effect on almost every other KPI on this list.
Formula: (Number of departures ÷ Average headcount) × 100
A new technician typically takes months to reach the productivity and FTFR of an experienced one, because so much field service knowledge lives in a tech’s head, not a manual, things like which valve on which model tends to stick, or which customer prefers a call ahead. Every departure resets that clock and drags down utilisation and first-time fix rate while the replacement gets up to speed.
Retention also connects directly to CSAT. Customers on recurring contracts notice when a different, unfamiliar face turns up every visit, and that unfamiliarity shows up in satisfaction scores even when the work itself is fine.
Track turnover quarterly rather than monthly, since small headcounts make monthly rates noisy and misleading. Pair it with an exit reason category (pay, workload, career progression, culture) so the number tells you what to actually fix rather than just that something needs fixing.
Author perspective: don’t chase every KPI at once
Revenue per truck tells you more in five minutes than most dashboards tell you in an hour, it blends pricing, utilisation and dispatch efficiency into one honest number. My real concern with most KPI advice is volume: managers try to track fifteen metrics and end up acting on none. Pick two, fix them, then move on. Iteration beats ambition here every time.
— Hayley
Try Ask Hayley to close the gap between good KPIs and good data
Every KPI in this guide depends on the same thing: consistent, timely data that isn’t sitting in someone’s memory or a notepad on the dash. Ask Hayley is built for exactly that gap, a voice-first assistant that answers calls, logs jobs, and pushes invoicing details into Xero or AroFlo without you or your team stopping to type anything up.

For a trade business juggling response times, CSAT capture and DSO all at once, that’s the practical difference between chasing numbers at month end and having them ready when you need them. If compliance paperwork is part of your KPI headache too, Ask Hayley’s safety and compliance documentation service takes that off your plate as well. Book a look at the Assistant and Office Manager plans and see how much of your admin week disappears when Hayley picks up the phone.


